
Curves
Clicking on the T14 grid line to darken the test strip T14 to T12
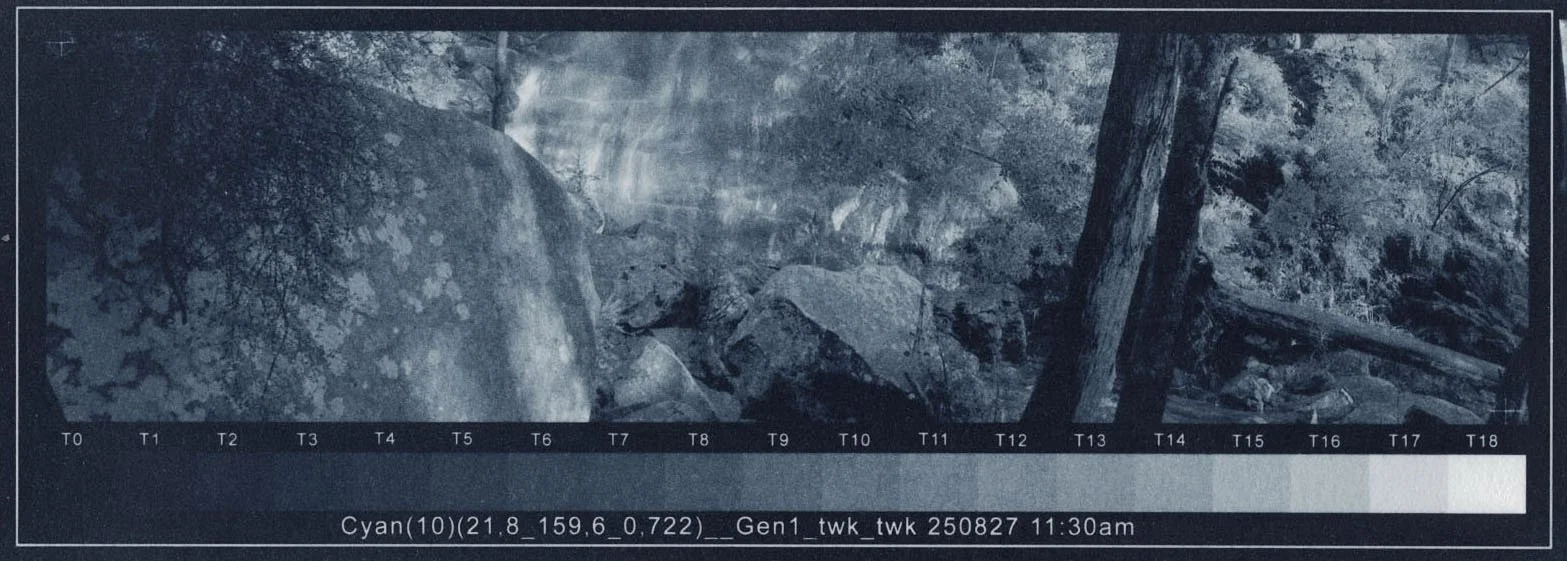
Test Strip Template showing the tones that correspond to the plot grid lines.
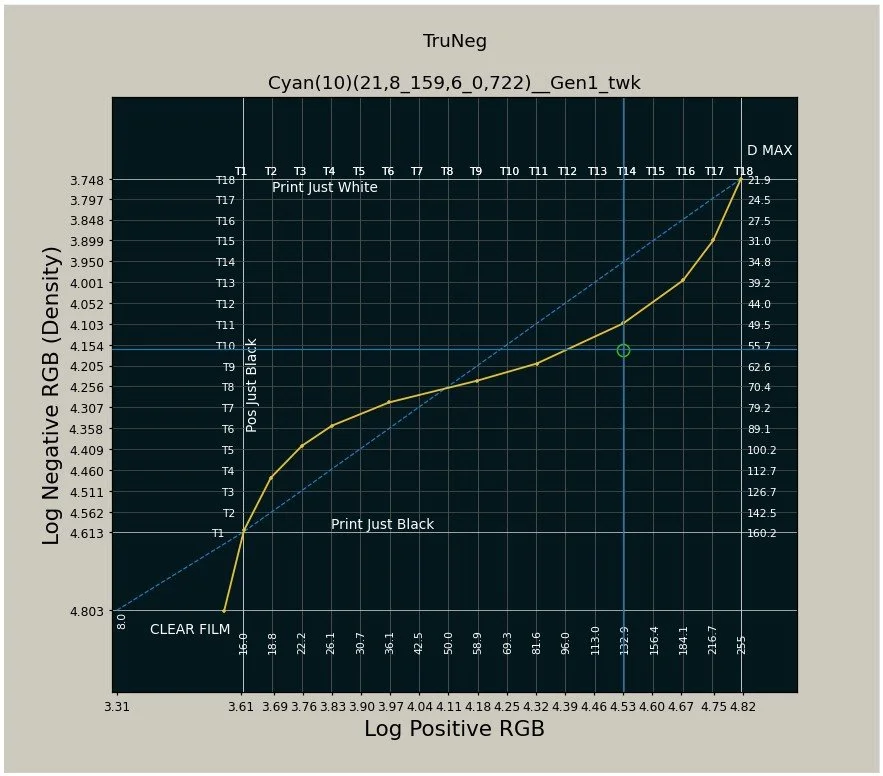
The chart plots the 16-bit logarithms of the positive inputs and negative outputs and the negative axis is reversed so that the plot follows the tradition of the DLogE curve of the negative getting darker as the image becomes brighter.
The curve is corrected by clicking on the plot to define new control points. Clicking below the curve darkens the print; clicking above lightens it. Points can be added anywhere, between existing points, dragged by holding down the left mouse button, and removed by right-clicking. The only limitation is that they cannot be closer than approximately half a grid space to each other.
A new preset is saved by clicking on or just below the line marked Clear Film, and the letters “twk” are appended to the file name to clearly identify that the preset has been amended.
Amending the Print
The TruNeg curve provides a predictable pathway to fine-tuning the print as each gridline corresponds to a step in the template stepwedge, so that changing the curve by one grid line changes the printed stepwedge by one tone.
The negative value that produces the tone in the test strip is the intersection of the yellow plot and the positive grid line. For example, to darken the stepwedge tone T14 to T12, the horizontal cursor is aligned with the intersection of the positive T12 grid line and the yellow plot, and the mouse is clicked on the T14 gridline.
Generally, the highlights are more easily corrected and understood by referring to the stepwedge and the shadows by checking the actual print.