
Working with Profiles and the DLogRGB Curve
Before commencing, check that the monitor and printer are set up as detailed in the Settings page.
Overview
Find the “Just White” and “Just Black” points of the printer/process.
Enter them into the app and load the chosen Profile.
Prepare and print a test strip using the TruNeg Test Strip Template
Assess the test strip and correct any incorrect tones using the DLogRGB curve.
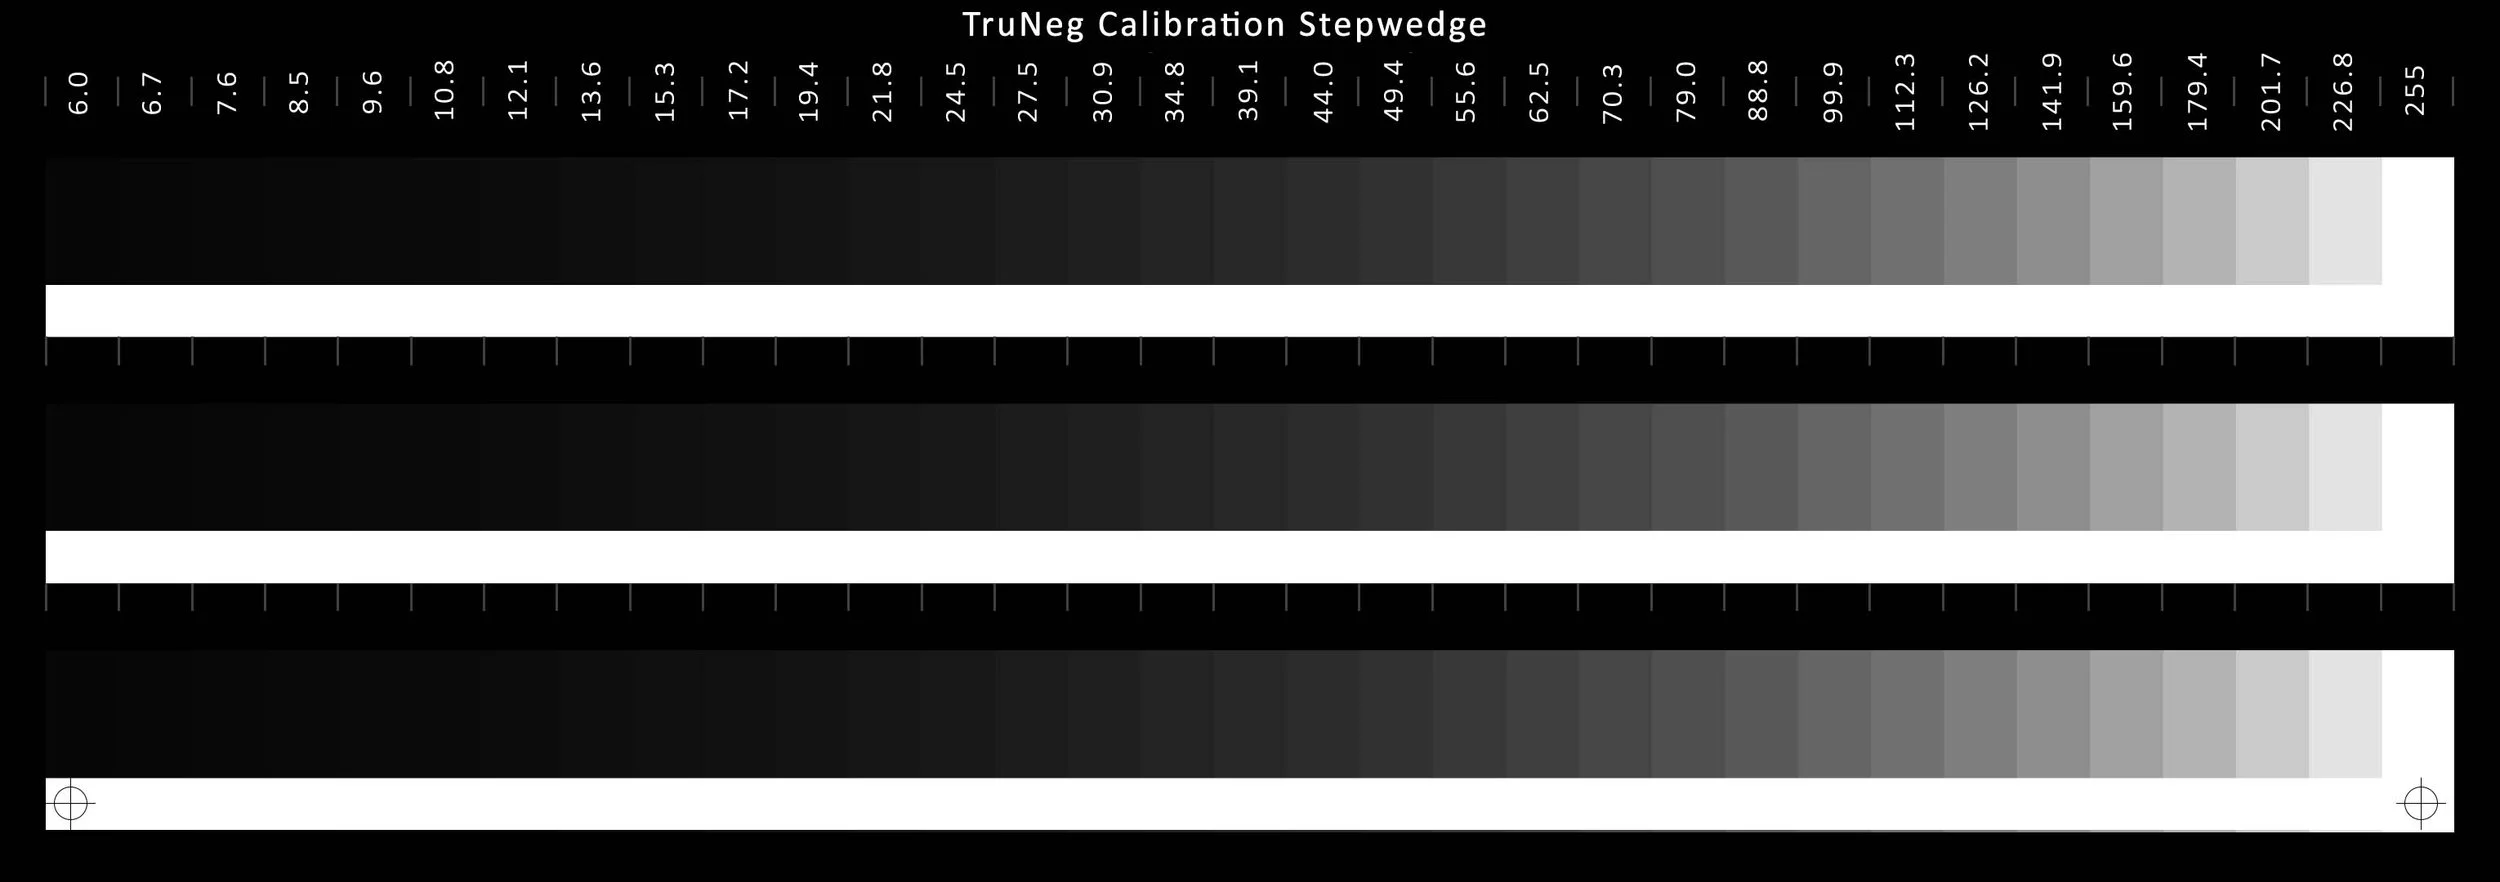
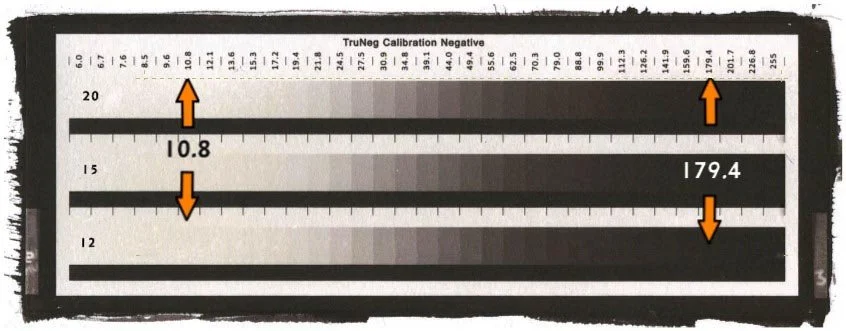
To find the exposure and white and Dmax points, make a test print of the Calibration Stepwedge downloaded from the website with a stop difference between each stepwedge. This is most easily done by setting the time to, say, 5 minutes, exposing once overall, then covering up the first strip, exposing once again, then covering up the second strip, and exposing twice to give a 5, 10 and 20 minute test print. If necessary, repeat by interpolating between one that is too light and one that is too dark.
The minimum exposure is when at least the last two steps cannot be separated from the adjacent clear film strip. Note that there is no single perfect exposure, as long as there is a clean paper white and a good maximum density.
When happy with the exposure, inspect the dried test print and determine the RGB values for “Just White” and “Just Black”.The “Just White” point is usually obvious, but the “Just Black” point can be confusing. Rather than trying to track down the very last tone that can be separated from the adjacent Dmax strip, run your finger down along the Dmax strip and stop at the first obvious point where the stepwedge merges into Dmax.
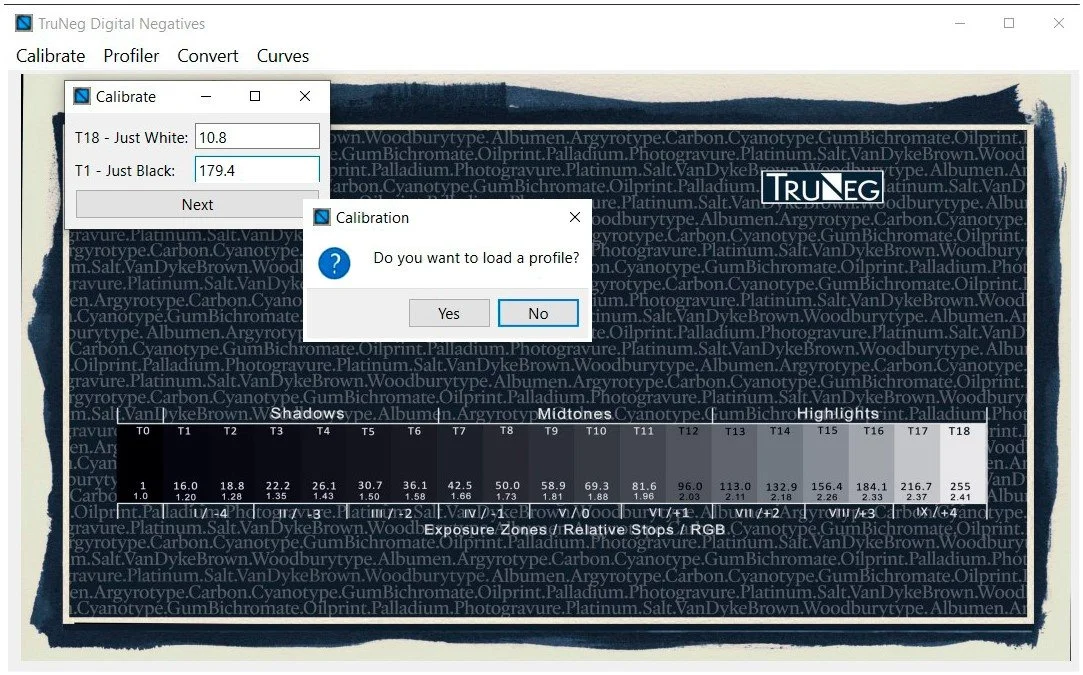
Open the Calibration menu and input the two RGB values that produce ”Just White’ and ”Just Black”.
Pressing Next opens a window prompting you to choose a profile. Press “Yes”, then load the Profile previously downloaded from the Website. Save the Preset, giving it a 3- or 4-letter name that identifies the process; include the exposure time in brackets. The program then adds the white and black values, the overall gamma, and a short suffix identifying the profile used. If the curve is tweaked, “twk” is appended to the name each time it is modified.
E.G. Salt(12)(10,8_179,4_1,016)Slt_twk_twk
While this creates long file names, keeping a clear and accurate record of each negative and print makes life much easier.
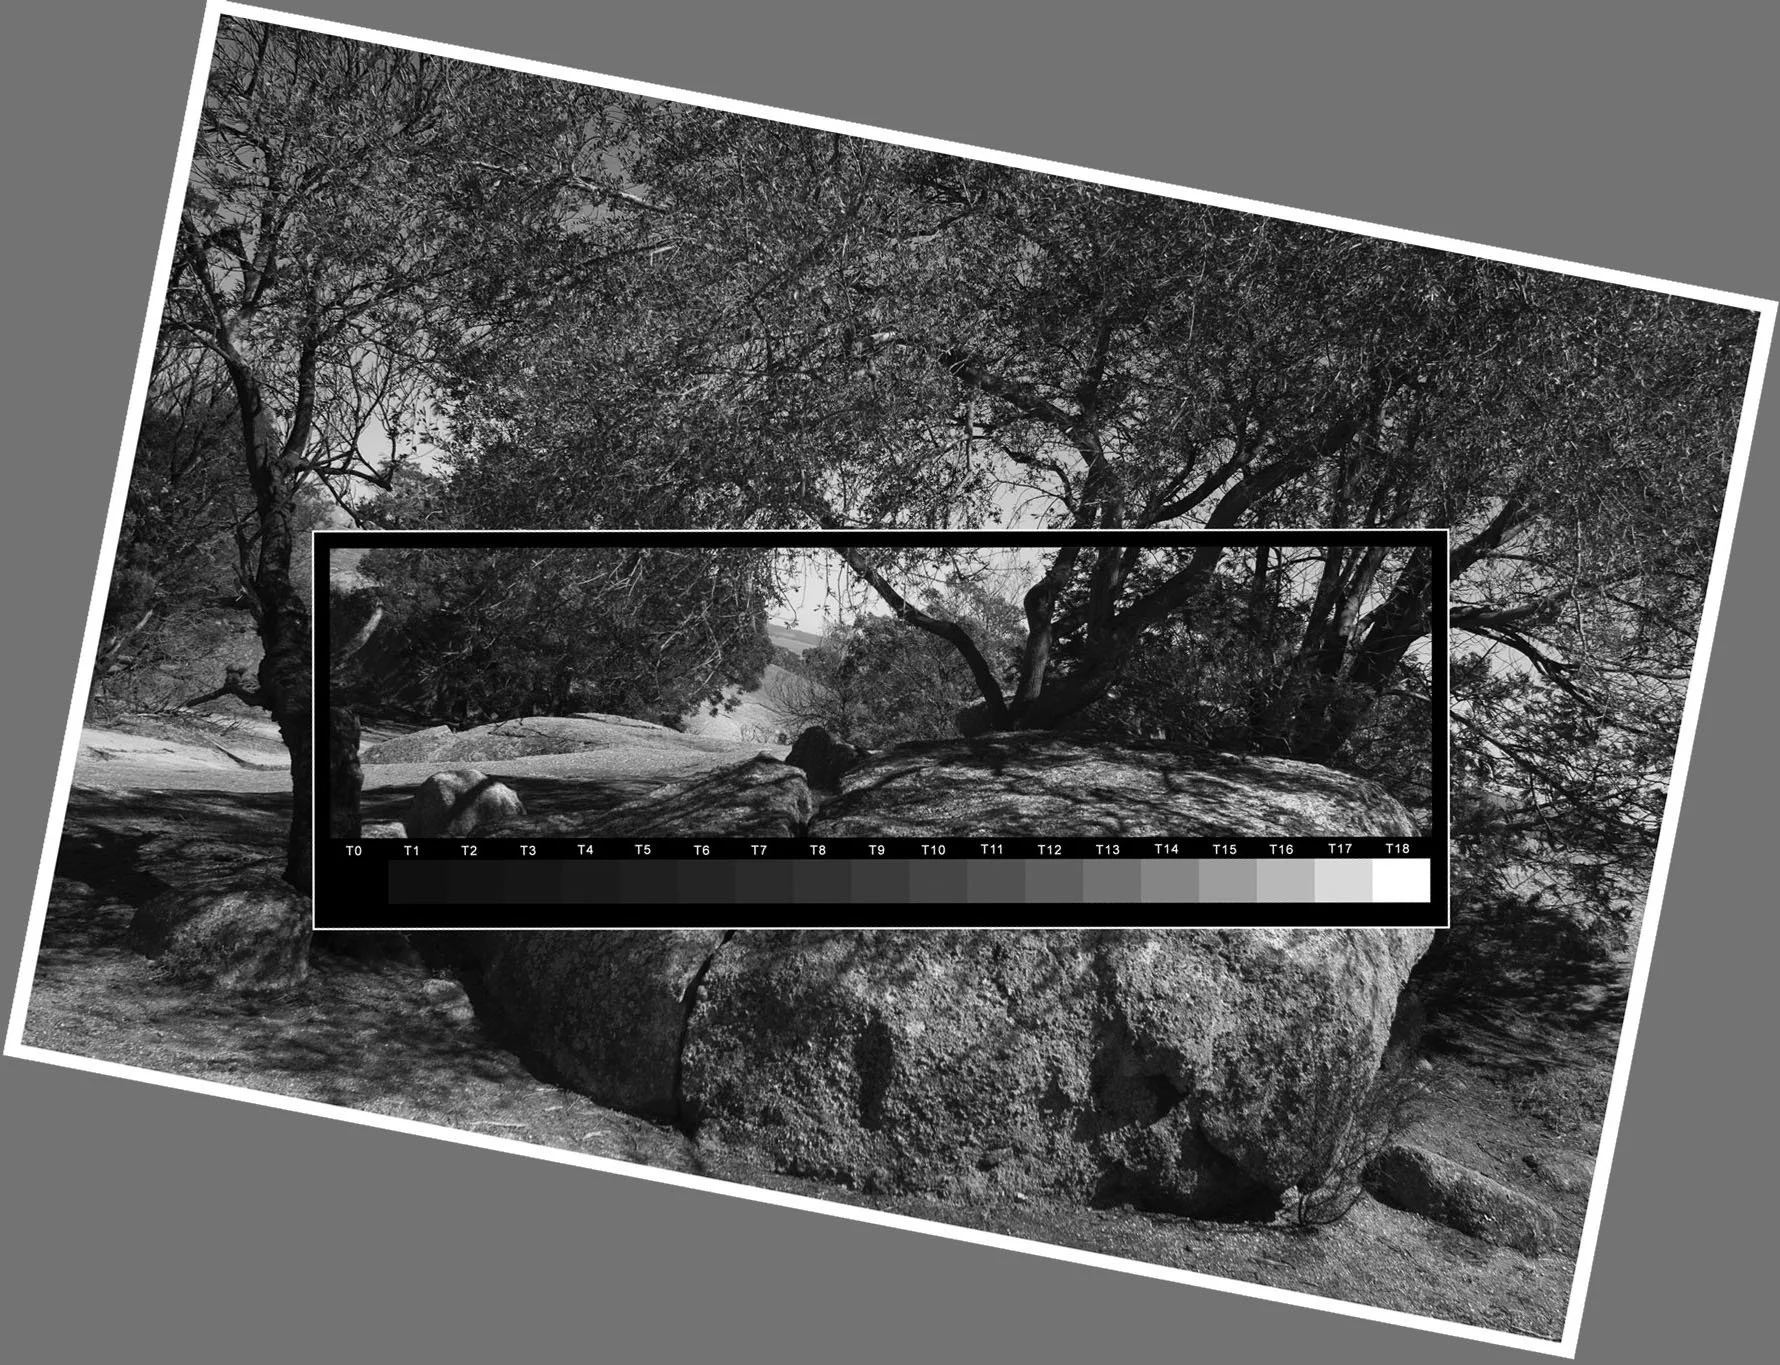
Download and open the Test Strip Template and select parts of the image with important highlights and shadows, rotating the Template if necessary.
The Template contains an 18-step 16-bit logarithmic stepwedge.
Tones T1 and T18 are the just black and just white values.
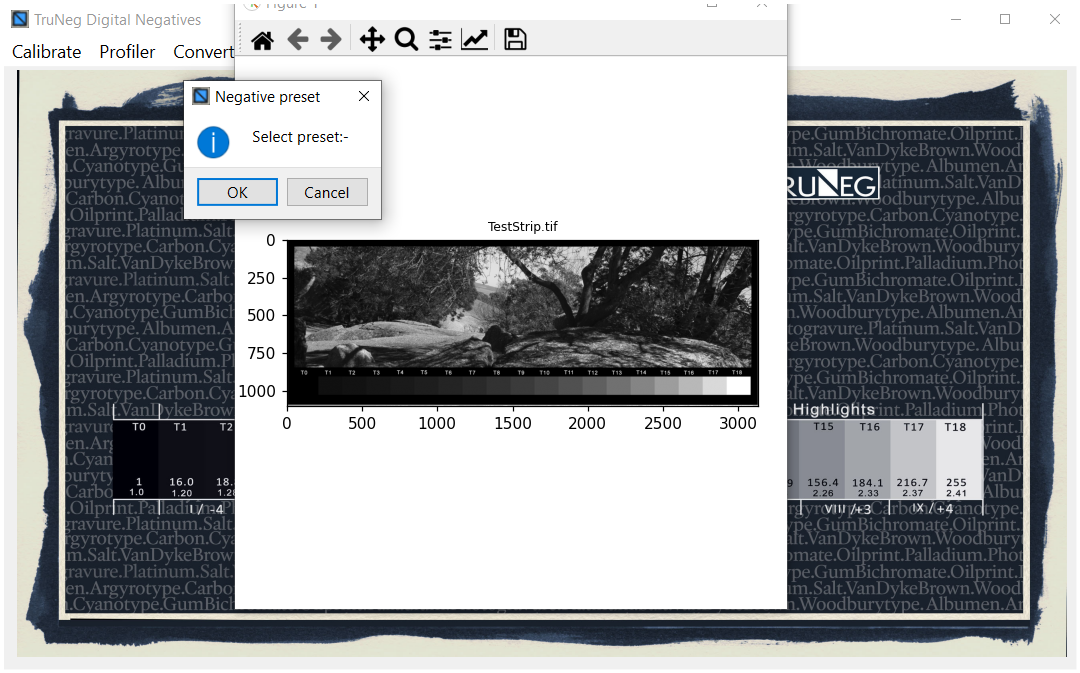
In the Convert Menu, open the Test Strip Template, select the Preset and press OK to convert the test strip into a negative. When finished, the test strip automatically exports back to the Preset folder, ready for printing.
Copy the Preset name and paste it into the border of the negative and print the test strip. Don’t forget to flip the canvas horizontally and check the printer settings.
Negatives can appear very dense and overexposed compared to traditional silver gelatin negatives. This is affected by the “Just Black” value chosen. In the negative opposite, the negative T1 density is substantially darker than T0 but will print nearly Dmax in the test strip,
Check that T18 is paper white. Depending on the process, it can be difficult to keep the white free of staining, and it is advisable to spend the time necessary to maintain a good white, as it has a significant effect on the overall brilliance of the print.
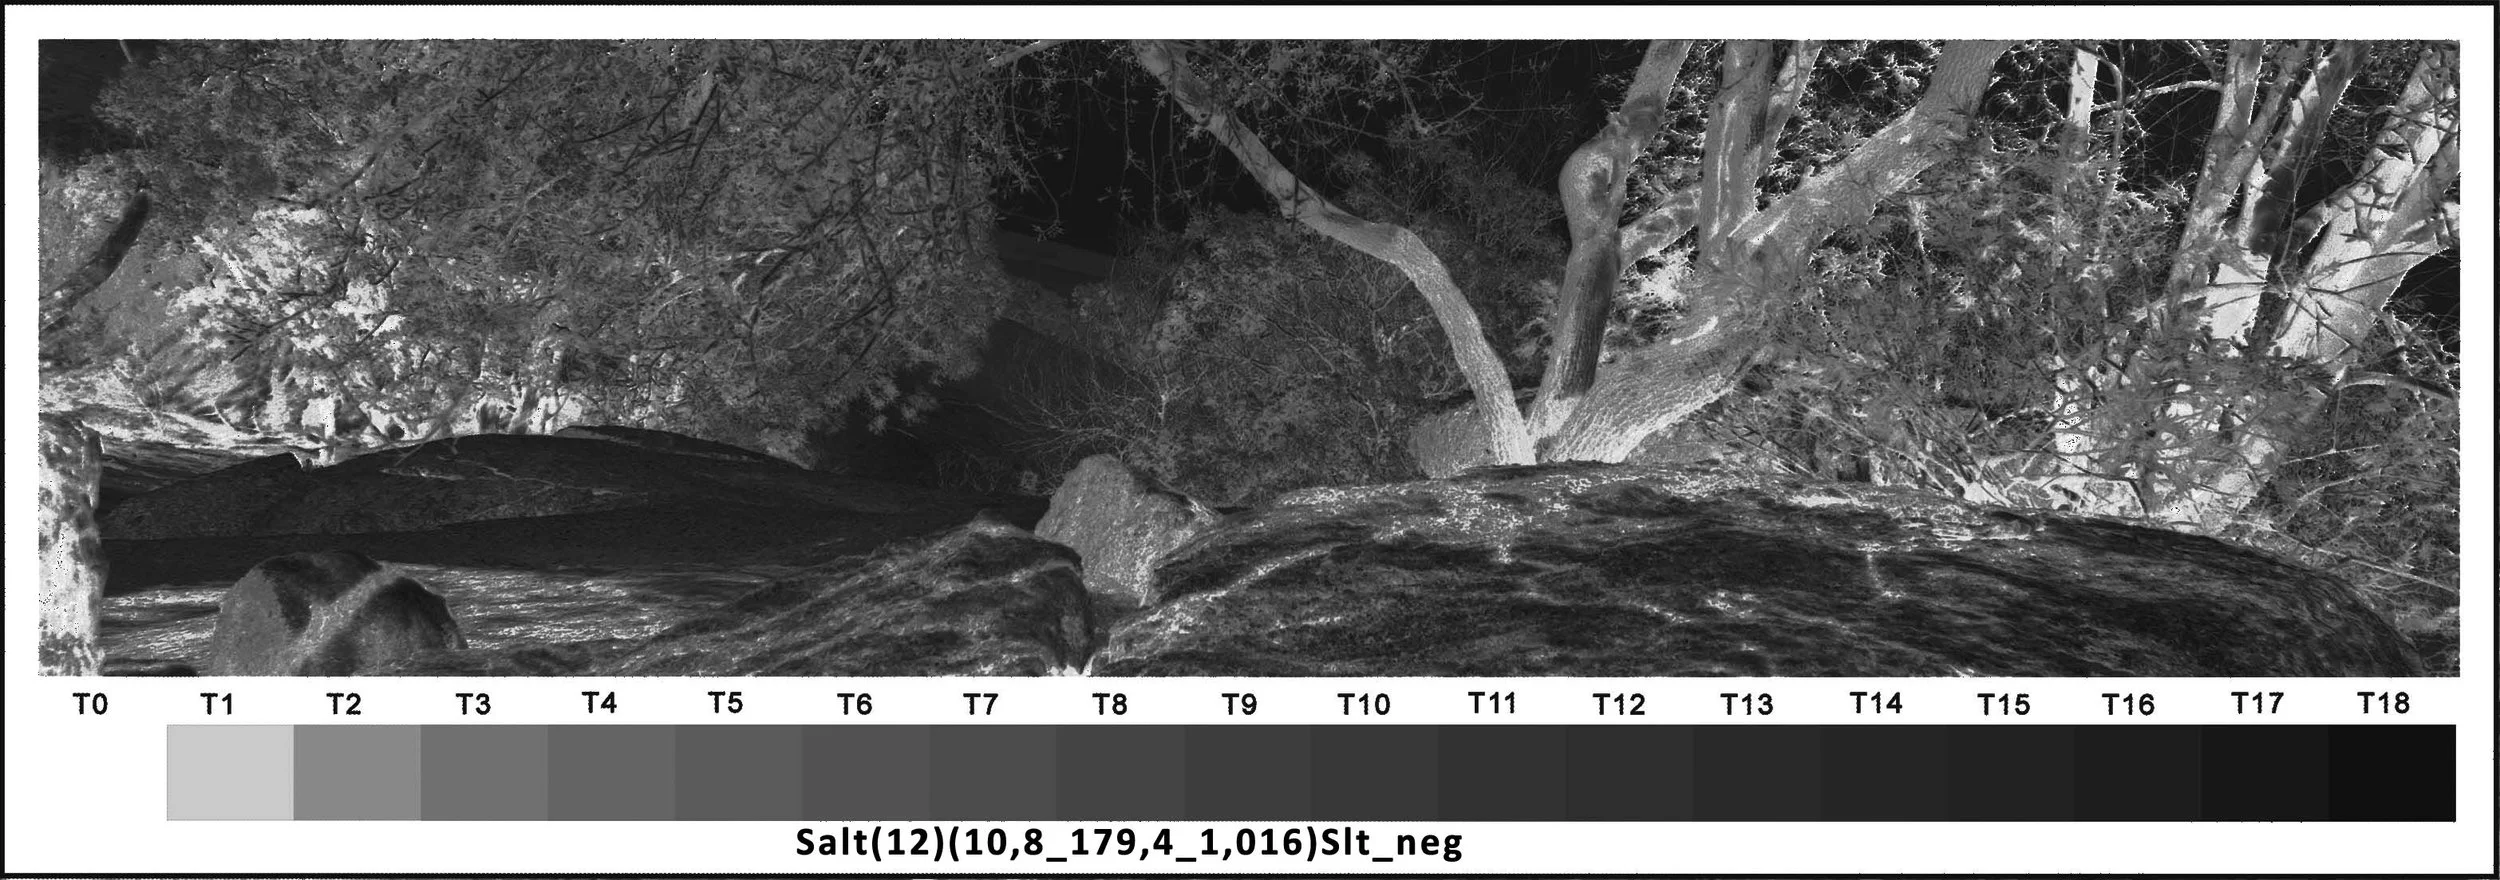
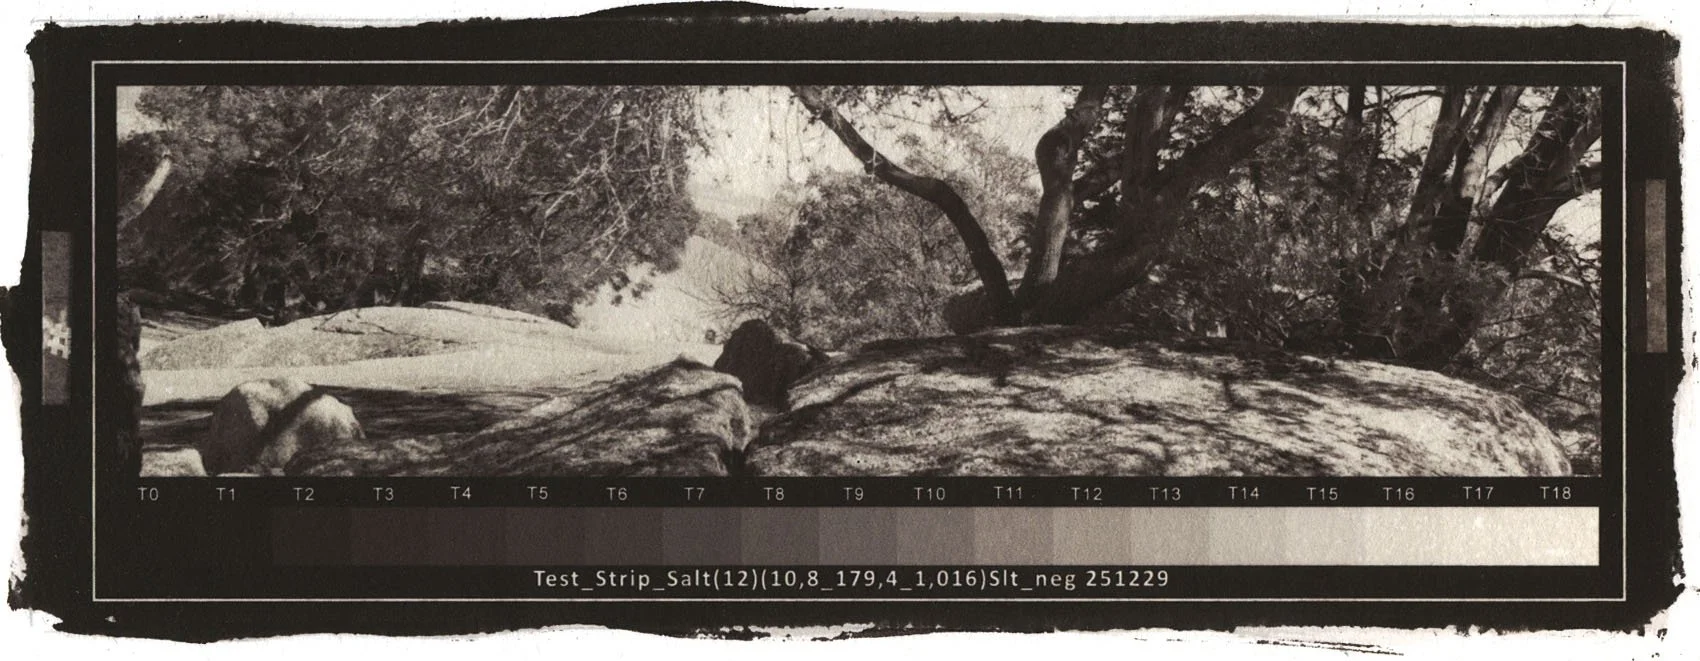
Assess the test strip and correct any unsatisfactory tones by adjusting the curve.
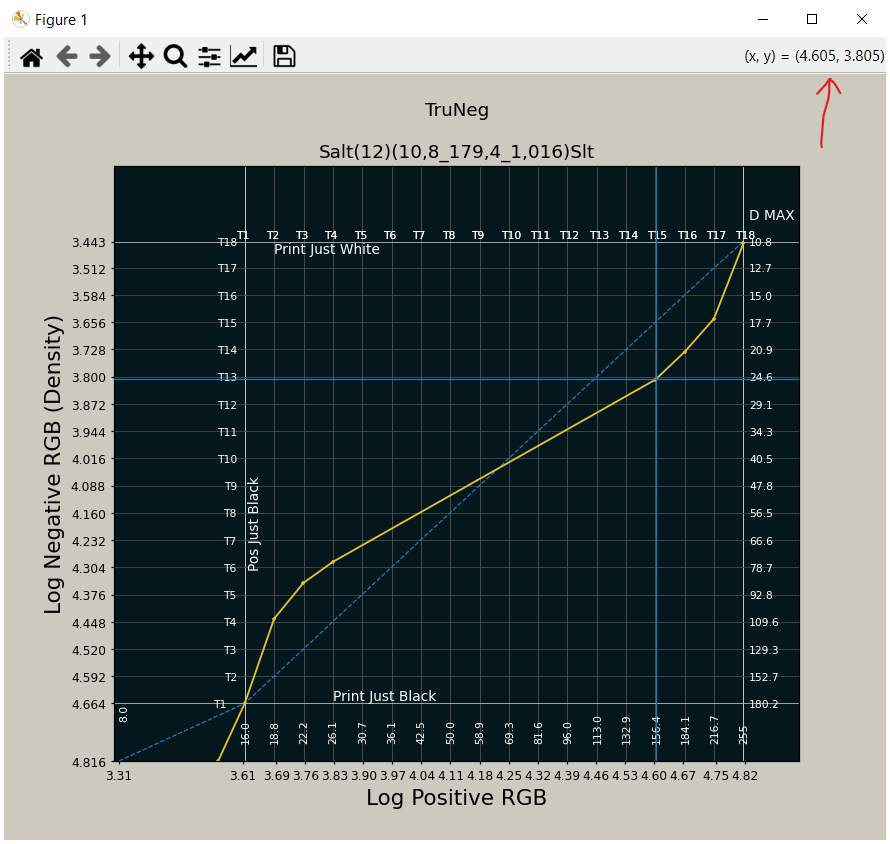
Each vertical grid line corresponds to a step in the Template’s stepwedge; the negative RGB value of each stepwedge step is where the curve crosses the matching vertical grid line.
Clicking above the curve lightens the print; clicking below darkens it. There is no limit to the number of points, other than that they cannot be closer than approximately half a grid space. They can be added between points, removed by right-clicking, moved by left-clicking, holding and dragging, and placed anywhere on or between lines. However, if a profile is to be extracted from the curve, all points must be on a vertical grid line. See Profile/Create Profile.
The dashed blue line is the negative that would print correctly if the process and printer had uniform contrast across the tonal range.
The Y-axis values are inverted so that as positive values get brighter, the negative becomes darker, matching the traditional DLogE curve convention.
The exact value of any x,y coordinate is shown just above the chart’s right-hand side. The values are in sixteen-bit RGB logarithms. To convert to the familiar 8-bit value, use a calculator to find the number’s anti-log and divide by 257.
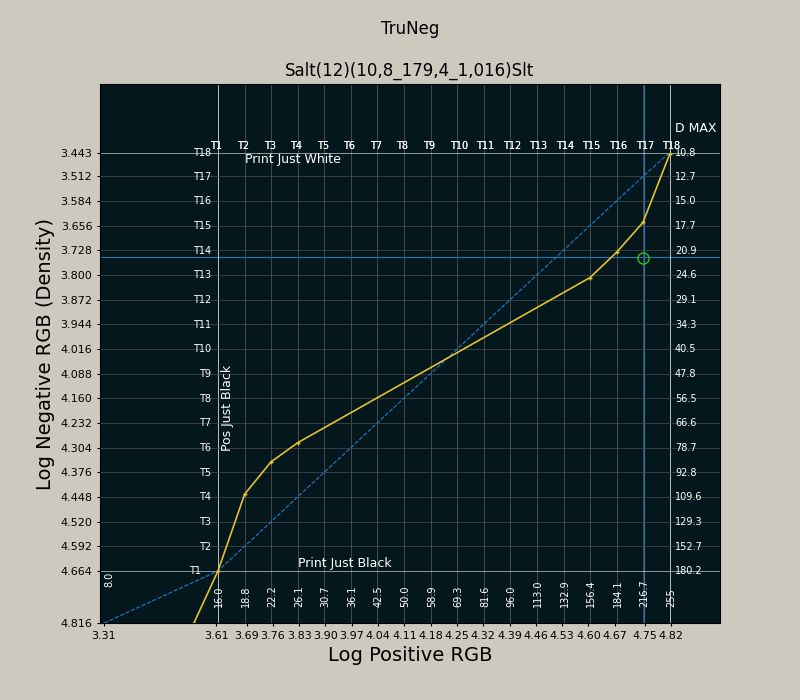
Create a second point where the curve starts to turn down.
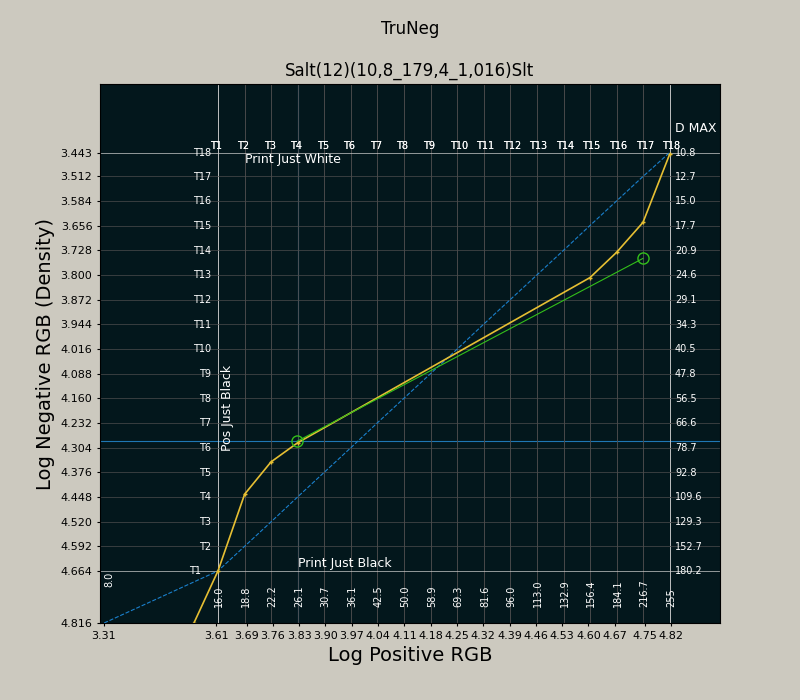
Left click and hold to enlarge.
When editing, think in terms of the print.
In the example test strip above, the print highlights are too light, and the T17 step, the last before “Just White”, is barely visible.
To darken T17 to a little darker than the T16 step, align the horizontal cursor crosshair with the yellow curve just below where it crosses the T16 vertical grid line, keeping the vertical crosshair on the T17 line, and left-click to create the first point of the new curve.
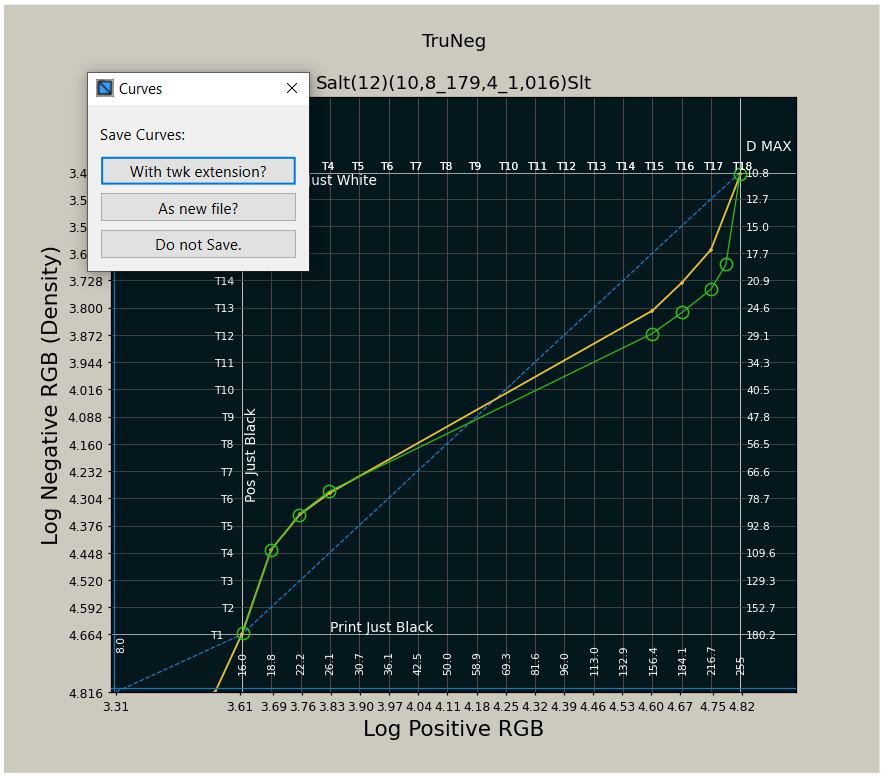
Smooth out the curve highlights, keeping the overall form of the curve. Note that while the new point below T15 is closer to the curve than T17, the horizontal crosshair crosses the yellow curve more than one vertical gridline from T15 so that T15 will also be more than one step darker.
Note that a point has been included betweeT17 and 18 to smooth out the highlights, indicating the subtle control there is over the print.
The slope of the curve indicates the process contrast; the steeper the curve, the lower the process contrast, so large changes need to be made to cause a significant change, but where the curve is flatter, smaller changes affect the same print change.
To save the curve, left-click on the bottom-left corner of the plot area.
Convert and print the new test strip with the tweaked Preset.
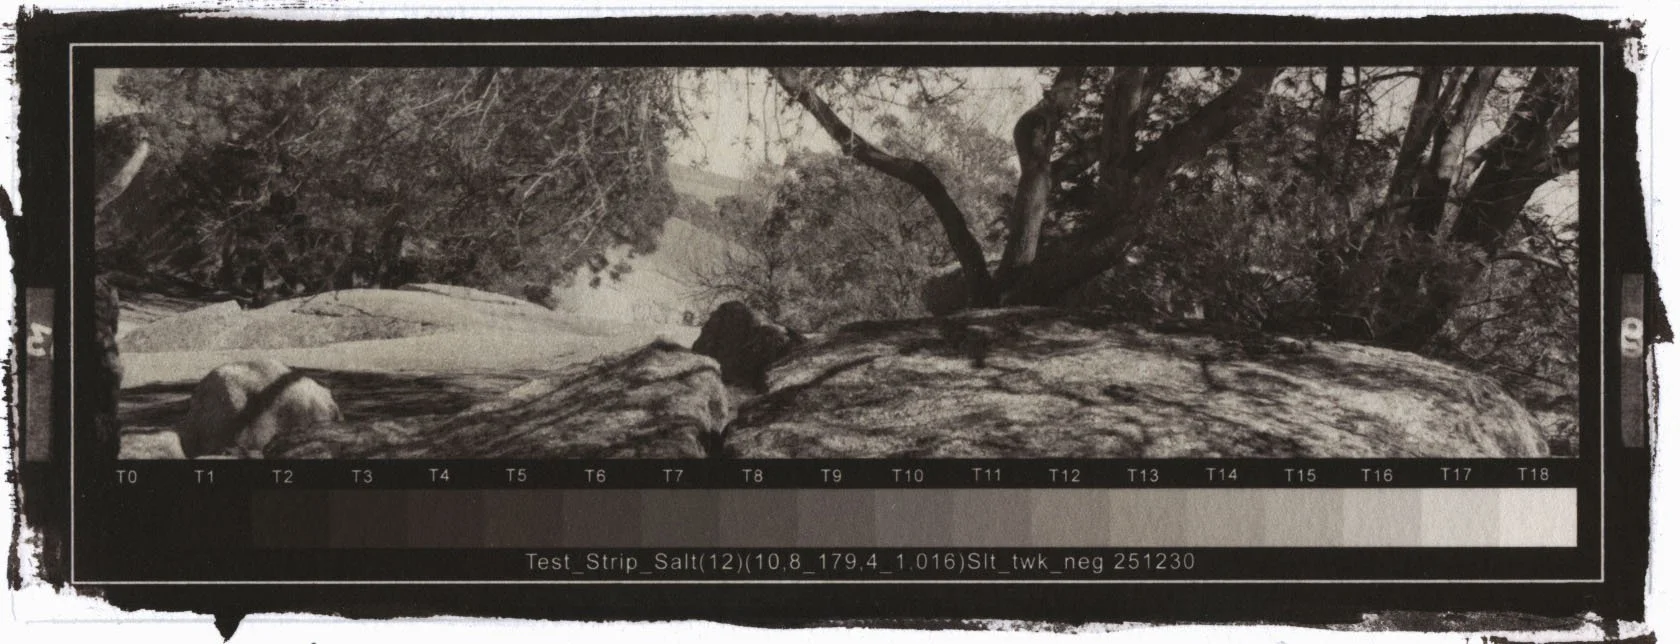
As can be seen from the small changes in the RGB values in the curve’s highlights, these tones are the most demanding for the printer, and most problems are likely to occur here.
If the highlights and dark shadows look OK but the print and stepwedge appear too light, darken the midtones, again keeping the overall shape of the curve. Conversely, if the test strip appears too dark, lighten the midtones.
While this requires some experience and expertise, you can craft the print to your own ideas, providing the satisfaction of a fully handmade print.